INFO
This page was translated by an LLM. Some details and nuances may differ from the original.
Dashboard and authentication
WARNING
If you do not specify auth, all requests to the REST API and the dashboard receive a 404 response.
bearerAuth
bearerAuth authenticates requests with a single token.
import { bearerAuth, defineTsumugi } from 'tsumugi';

const tsumugi = defineTsumugi({
  performers,
  auth: bearerAuth((env: Env) => env.TSUMUGI_TOKEN, { cookie: 'tsumugi_token' }),
});
Retrieve the token from a Secret with a function, as in the example above.
If you write the token directly as a string, it is included in both the repository and the bundle, which creates a security risk.
cookie
When you specify the cookie option, Tsumugi validates the token in the cookie with the specified name, in addition to the Authorization header.
The browser does not send the Authorization header when it fetches the initial HTML.
This setting is required to open the dashboard.
Cookie authentication can be subject to CSRF.
The side that issues the cookie must explicitly specify SameSite=Strict.
Cloudflare Access
When you specify cloudflareAccess, Tsumugi validates the JWT issued by Cloudflare Access.
import { cloudflareAccess, defineTsumugi } from 'tsumugi';

const tsumugi = defineTsumugi({
  performers,
  auth: cloudflareAccess({ teamDomain: 'example', aud: 'audience tag' }),
});
| Name | Description |
|---|---|
teamDomain | The team part of <team>.cloudflareaccess.com |
aud | The audience tag of the Access application |
cacheTtlMs | The refetch interval for the JWKS. The default is 1 hour |
Custom authentication
To implement custom authentication, specify a function in the auth option.
The arguments of this function are request and env.
The return value of this function is a Response or undefined.
If it returns undefined, authentication succeeds and Tsumugi continues processing the request.
If it returns a Response, authentication fails, and Tsumugi responds with that Response and stops processing.
For example, you can check the session with findSession and return a 401 Response if none exists.
import { defineTsumugi } from 'tsumugi';

const tsumugi = defineTsumugi({
  performers,
  auth: async (request, env: Env) => {
    const session = await findSession(request, env);
    return session ? undefined : Response.json({ error: 'unauthorized' }, { status: 401 });
  },
});
Configuration without authentication
DANGER
If you specify unsafeNoAuth, the REST API and the dashboard do not require authentication.
Every user who can reach the Worker can view job contents, including the payload, and can enqueue, cancel, and rerun jobs.
Do not use it in a public environment.
Use unsafeNoAuth only when authentication is performed in front of Tsumugi.
Examples include a configuration where Cloudflare Access is applied to the entire route, and checking behavior with wrangler dev.
When you do not authenticate, do not omit auth; specify unsafeNoAuth explicitly.
While unsafeNoAuth is specified, a warning is written to the log.
import { defineTsumugi, unsafeNoAuth } from 'tsumugi';

const tsumugi = defineTsumugi({
  performers,
  auth: unsafeNoAuth(),
});
Enabling the dashboard
When you pass ui() from tsumugi/ui to the ui option of defineTsumugi, Tsumugi responds with the dashboard HTML to GET requests for paths other than /api.
If you do not specify ui, the dashboard is not included in the bundle.
When the API responds with 401, the dashboard displays a token input field.
import { ui } from 'tsumugi/ui';

const tsumugi = defineTsumugi({
  performers,
  auth: bearerAuth((env: Env) => env.TSUMUGI_TOKEN, { cookie: 'tsumugi_token' }),
  ui: ui({ tokenCookie: 'tsumugi_token' }),
});
| Name | Description |
|---|---|
tokenCookie | The name of the cookie that stores the token. The same value as cookie in bearerAuth |
Job list
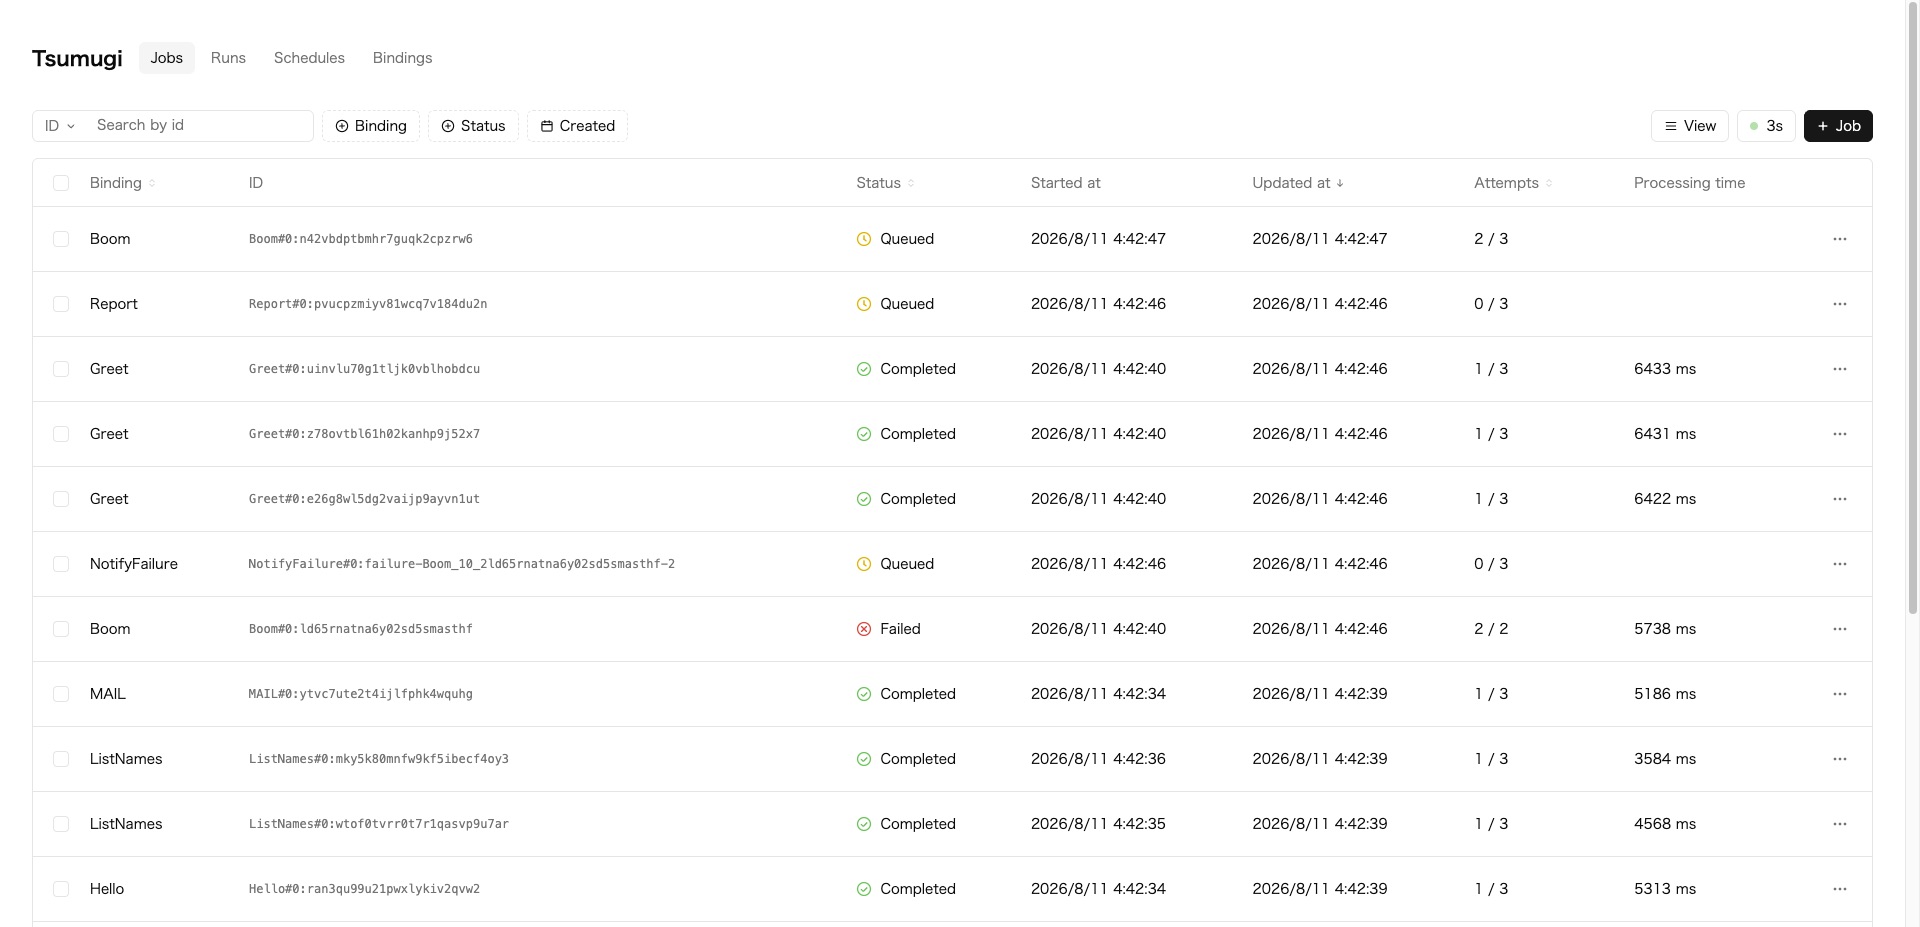
In the job list, you filter by status, binding, and creation time range, page through the results, and sort by column.
You can also search by job ID, uniqueKey, and concurrencyKey.
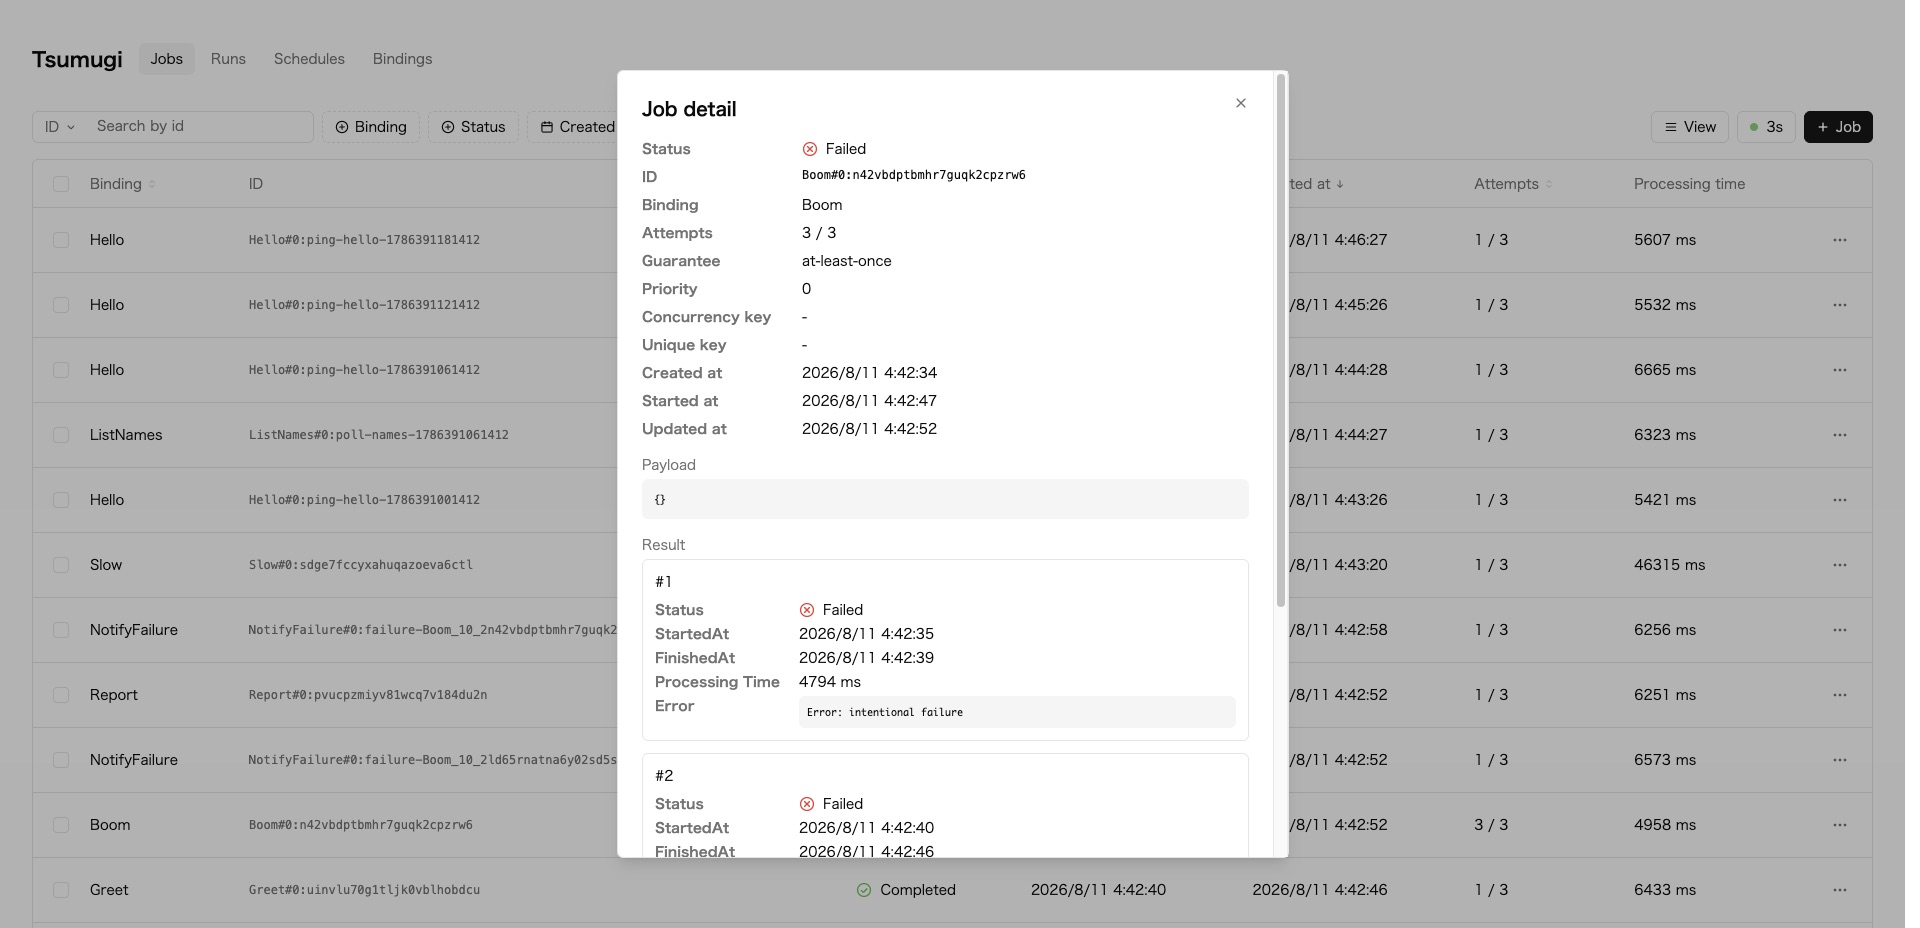
The job detail page shows the attempt history, progress, logs, and trace information.
Manual retry and cancel, bulk retry and bulk cancel of selected jobs, and job enqueueing are also done from the job list page.
Search
The value you enter in the search field is matched exactly.
If you enter a value that matches the job ID format, the details of that job are displayed.
Bulk operations
Select jobs with the checkbox at the left end of each row.
The checkbox in the header row selects all displayed rows.
When you select one or more jobs, a menu appears for retrying or canceling the selected jobs together.
Display settings
Display settings are saved in the browser and applied in later sessions.
Choose the refresh interval from Off, 1s, 3s, 10s, 30s, and 1m; the default is 3 seconds.
You can toggle the display of the ID, Started at, Updated at, Attempts, and Processing time columns.
Binding and Status are always displayed.
Choose the page size from 10, 20, 30, and 50.
Switch the language between Japanese and English at the bottom of the sidebar.
On first use, it follows the browser's language setting.
Time display
Times for recurring executions are displayed in each schedule's time zone.
All other times are displayed in the browser's IANA time zone.
Every time is accompanied by its IANA time zone and GMT offset.
The creation time range is specified by year, month, and day in the browser's local date.
Job details
Attempt history
The start time, end time, and error of each attempt are shown in the job details.
For the maximum number of stored entries and the maximum length of the error body, see Failure and retry.
The attempt history is included only in the job detail response, not in the list response.
An attempt that succeeds on the first try is not recorded in the history.
Logs and trace information
Messages saved with ctx.log() appear in the job details in the order received.
Each log includes the attempt number, the recorded time, and the body.
Logs of running jobs are also displayed, but it may take some time before they appear.
For the maximum number of stored entries, the body length, and the storage interval, see Logs.
The log retention period is the same as the job retention period.
For a job enqueued with traceparent specified, that value is displayed in the job details.
For how to use it in a performer, see Trace information.
Retryability display
Each row in the list includes retryable.retryable indicates whether the job is FAILED or STALLED and is within its retention period.
A successful retry is not guaranteed.
For a retry request on a job past its retention period, the REST API responds with 410.
Runs
If flows is configured, a Runs item appears in the sidebar.
If flows is empty, it is not displayed.
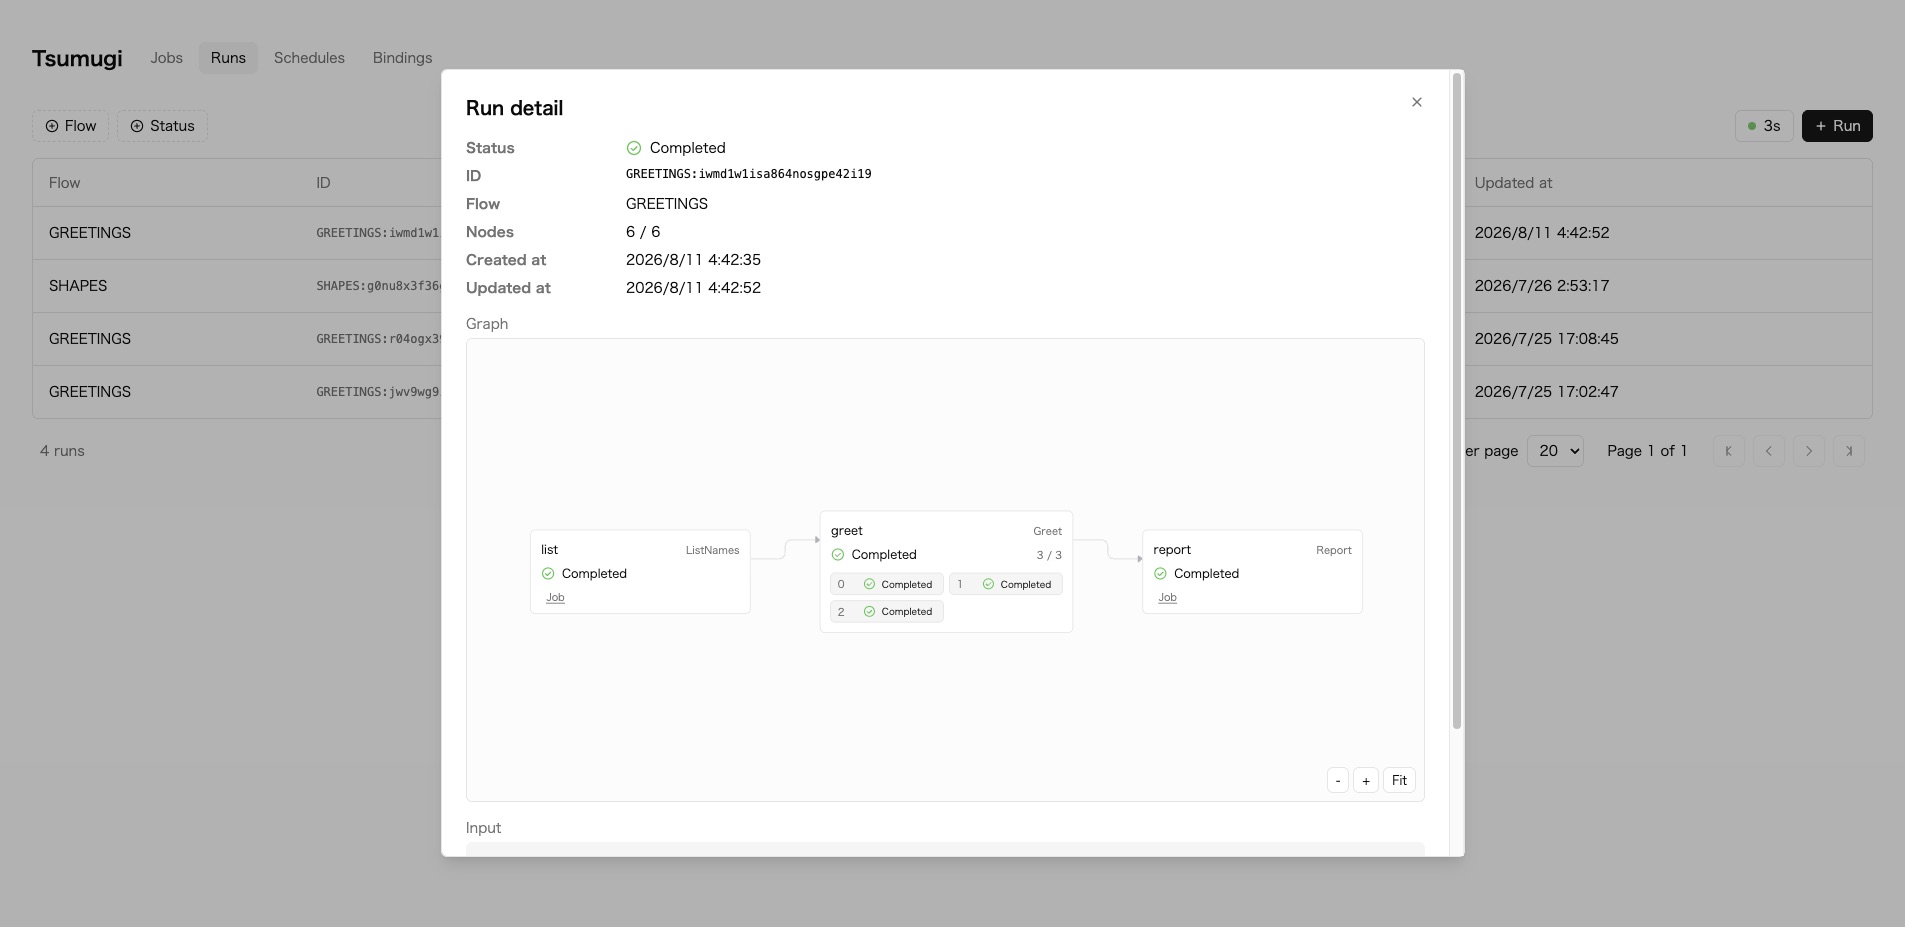
The Run list shows the Flow, status, and node progress.
If you specify a Flow or status, only matching Runs are listed.
Selecting a row opens the detail panel.
The detail panel offers two views: graph and waterfall.
The waterfall lays out the execution time of each node on a time axis.
The graph shows node dependencies, the status of each node, and the progress of the child nodes of a fan-out node.
Up to 24 child nodes are displayed, and the remainder is shown as counts by status.
Selecting a waterfall row or a graph node opens the details of that job.
In the details of a Run started as a subflow, the parent Run's ID is shown as a link.
Selecting this link opens the parent Run's details.
A subflow node in the graph has a button that opens the child Run's details.
Selecting a subflow row in the waterfall also opens the child Run's details.
Start, resume, and cancel Runs from the Runs page.
Only FAILED Runs can be resumed, and only RUNNING Runs can be canceled.
Published: Last updated: